> For the complete documentation index, see [llms.txt](https://guides.gresb.com/llms.txt). Markdown versions of documentation pages are available by appending `.md` to page URLs; this page is available as [Markdown](https://guides.gresb.com/completingassessments/data/results-insights/score-contribution.md).
# Score Contribution
Get deeper insight into how individual assets contribute to an entity's GRESB Score.
## Introduction
What is the Score Contribution Tool?
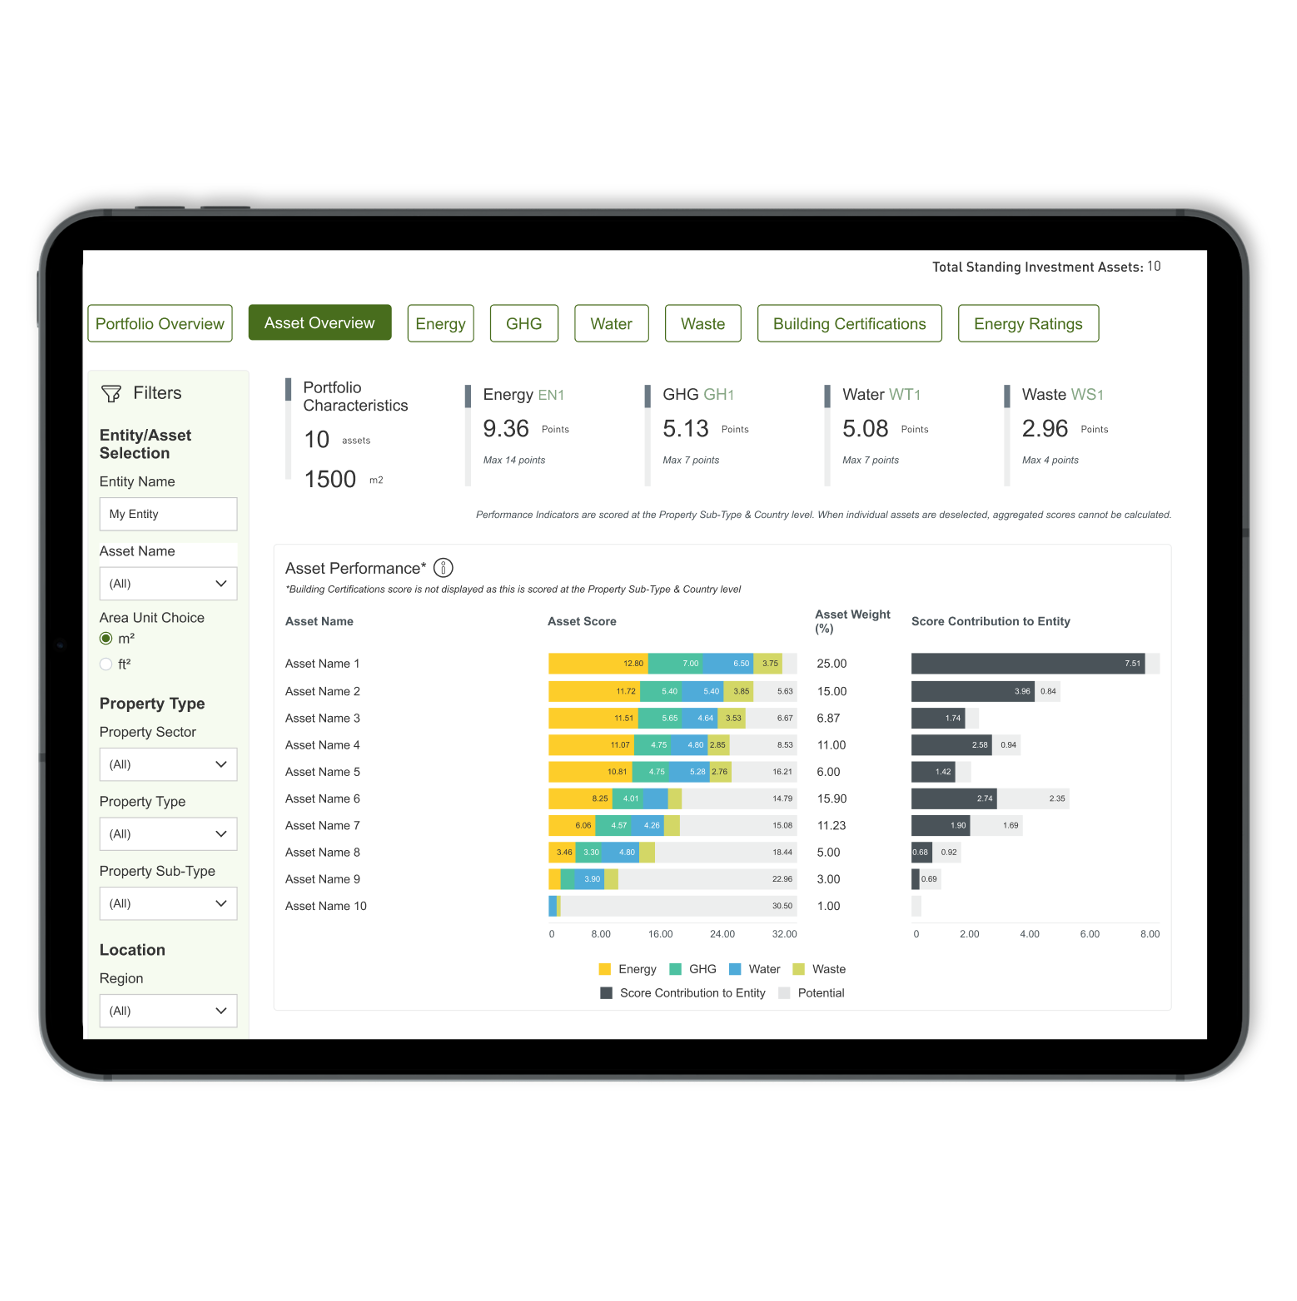
Score Contribution is a feature that gives Real Estate Participants deeper insights into how individual assets contribute to their overall GRESB Score.
It helps managers identify key areas for improvement and make data-driven decisions to enhance portfolio performance.
Users can use the private dashboard to track and explore assets at an aggregated level and across key performance metrics, to see which are helping or hurting their overall score.
* **Asset-level insights:** Understand how each asset impacts your portfolio’s overall score
* **Targeted action:** Identify the best opportunities to make performance improvements
* **Enhanced stakeholder engagement:** Use detailed scoring data to drive conversations with internal and external stakeholders
## User Instructions
Users & Access Rights
The Score Contribution dashboard is available to real estate entities completing the Performance Component of the GRESB Real Estate Assessment.
Score Contribution is included for Real Estate Assessment participants at no additional cost.
The dashboard reflects the information **submitted** in your Real Estate Assessment and provides valuable insights into scored asset-level performance. It does not use live Asset Portal data (for score simulation using the live data in the Asset Portal check the [Simulated Asset Scoring tool](/completingassessments/data/asset-analysis/simulated-asset-scoring.md)).
Users linked to the entity with the access rights of **Account Manager, Internal Contributor, or Investor Relations Manager** can see the Score Contribution dashboard.
{% hint style="info" %}
The Score Contribution tool is not available to investors.
{% endhint %}
{% stepper %}
{% step %}
### Select an Entity
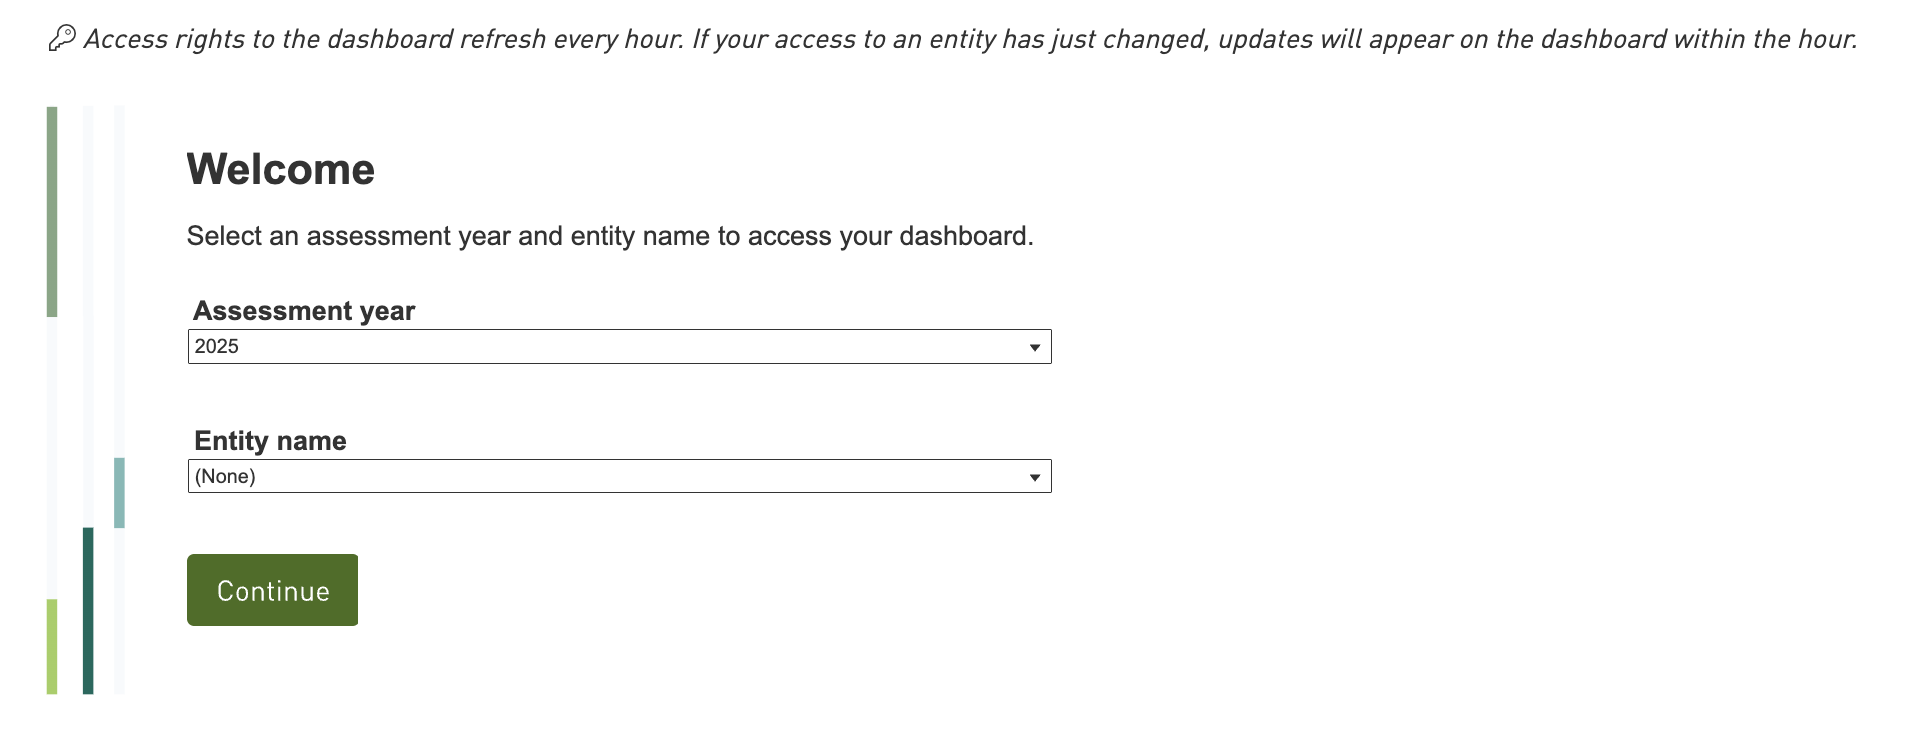
Select the year and entity for which you'd like to view asset-level scoring insights.
{% endstep %}
{% step %}
### Review Insights
Begin with the **Portfolio Overview** tab for a high-level picture of how the portfolio is performing. This view helps you quickly spot which segments show strong results and which may need attention.
Next, move to the **Asset Overview** to understand how each individual asset scores across all performance metrics. This provides an at-a-glance assessment of overall asset performance.
For deeper insight, explore the remaining tabs, which break down scores at the **indicator level**. These detailed views help you pinpoint specific areas where improvements can be made. Focus on the Asset Scores if you want to compare the performance of individual assets or the Score Contribution to identify where improvements will benefit the portfolio the most.
Use the filters on the left-hand side to refine the analysis. You can select any combination of locations, sectors, operational control subdivisions, or individual assets to focus on the results most relevant to you.
{% endstep %}
{% step %}
### Export and Share
You can export the data from the Score Contribution dashboard in Excel and continue the analysis offline.
Use the **Export** buttons available in each tab of the dashboard.
{% endstep %}
{% endstepper %}
## Methodology
Asset Weight
The asset weight determines the contribution of an asset's individual score to the overall portfolio score for each indicator. The asset weight is calculated by using a combination of:
1. The % GAV assigned to the relevant property sub-type and country, and
2. The asset’s share of total floor area within that same property sub-type and country, adjusted for ownership share and the duration of ownership during the reporting year.
For indicators where only some assets are eligible (such as *Energy Performance*, *GHG Like-for-Like*, and *Water Like-for-Like*), the asset weight is calculated based only on the total floor area of eligible assets within that property sub-type and country grouping.
**Asset Weight Formula:**
* Asset Weight = \[(% GAV of country/property sub-type) × (Asset owned floor area)] ÷ (Total owned floor area of all assets in that country/property sub-type)
* Owned floor area = Floor area x ownership % x ownership period %
{% hint style="info" %}
**Important note:** The ownership period % was introduced in 2026 for the owned floor area. It does not apply to previous years.
{% endhint %}
Score Contribution
Score Contribution to Entity reflects how much each asset’s score contributes to the overall portfolio score.
GRESB calculates it by multiplying each Asset Score by the Asset Weight.
Potential
Potential indicates the remaining points each asset could achieve, highlighting opportunities for improvement.
GRESB calculates it as the difference between the maximum score available for a given indicator and the asset’s actual score.
## Frequently Asked Questions
How often does GRESB update the Score Contribution dashboard?
The dashboard is refreshed twice a year, in line with Benchmark Reports: September 1st — Preliminary Scores and October 1st — Final Scores, at the release of GRESB Results.
Can I use Score Contribution to estimate my score during the reporting period?
No. Score Contribution reflects the data you submitted as part of your GRESB Real Estate Assessment. To work with live, non-submitted Asset Portal data, see [Simulated Asset Scoring](/completingassessments/data/asset-analysis/simulated-asset-scoring.md).
Does the Score Contribution dashboard display the same insights as my benchmark report?
The difference between the Score Contribution dashboard and the Benchmark Report lies in the level of granularity of the insights presented.
The Score Contribution dashboard focuses on providing asset-level scoring insights, while the Benchmark Report presents GRESB results at the portfolio level. Both tools present insights based on the same underlying reported data and scoring methodology.
How does Score Contribution differ from Asset Benchmarking (formerly REAL Benchmarks)?
Score Contribution insights focus on how individual assets impact your overall portfolio’s GRESB Score, in the aggregate and across key performance metrics. In contrast, Asset Benchmarking insights help you understand how assets within your portfolio perform relative to industry peers, decarbonization pathways, and your other assets.
Score Contribution and Asset Benchmarking work together to provide a complete picture of your portfolio’s performance. While Score Contribution gives insights into how each asset within your own portfolio contributes to your GRESB Score, Asset Benchmarking offers a market-wide comparison, allowing you to assess how your portfolio measures up against peers and which of your assets are under- or overperforming. Using both tools enables more informed decision-making and targeted improvements.
## Video Overview
{% embed url="" %}
---
# Agent Instructions
This documentation is published with GitBook. GitBook is the documentation platform designed so that both humans and AI agents can read, navigate, and reason over technical content effectively. Learn more at gitbook.com.
## Querying This Documentation
If you need additional information that is not directly available in this page, you can query the documentation by asking a question.
Perform an HTTP GET request on the following URL with the `ask` and `goal` query parameters:
```
GET https://guides.gresb.com/completingassessments/data/results-insights/score-contribution.md?ask=&goal=
```
`ask` is the immediate question: it should be specific, self-contained, and written in natural language.
`goal` is what the user is ultimately trying to achieve, the reason they need the answer. Sharing it helps GitBook give you a better, more relevant answer. A goal is most helpful when it describes the outcome the user wants rather than restating the question. For example, with `ask=how do I create an API token`, a goal like `automate deployments from our CI pipeline` lets GitBook tailor the answer to that use case.
The response will contain a direct answer to the question and relevant excerpts and sources from the documentation.
Use this mechanism when the answer is not explicitly present in the current page, you need clarification or additional context, or you want to retrieve related documentation sections.